YOLO is an object detection algorithm that can predict bounding boxes and class probabilities of objects in input images.
If you want to make a YOLO model with orientated boudning boxes you first need to have a dataset with images of what you want to detect. We used 70+ images but it is always recommended to use more for a better result.
Step 1: Go to https://roboflow.com/ and make an account if you don’t already have one.
Step 2: Create a new project and upload all your images.
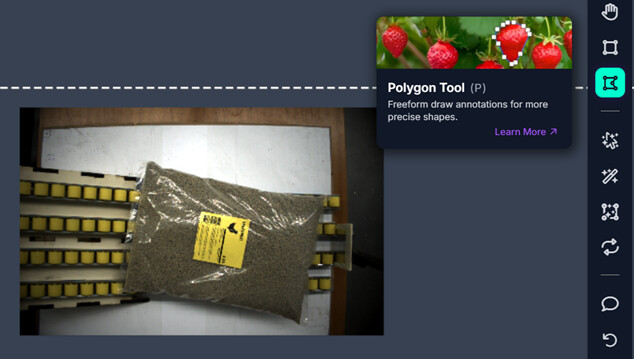
Step 3: Go to annotate and use the polygon tool to mark your objects.
Step 4: Upload the annotated images to your dataset and create a new version with your chosen train and valid split.
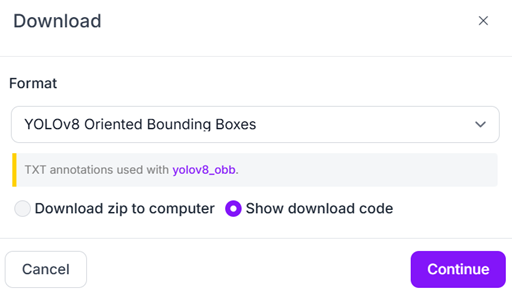
Step 5: Download the dataset with the OBB format and copy the link to your zip file.
Step 6: Run this code in google colab.
%pip install ultralytics 	# install

!wget *** -O roboflow.zip	# replace *** with your copied link

!mkdir -p /content/datasets

!unzip -o roboflow.zip -d /content/datasets

!cp -R /content/datasets/train/ /content/datasets/valid

from ultralytics import YOLO
import os
os.environ['WANDB_MODE'] = 'disabled'
model = YOLO("yolo11n-obb.pt")

results = model.train(data="/content/datasets/data.yaml", epochs=200, imgsz=640)	# You can change the amount of epochs to your liking
Step 7: Download your trained model. Go to content/datasets/runs/obb/train/weights and download ‘best.pt’*.
Step 8: Use the following code where you link your own model, to find the center and angle of the bounding box. Don’t forget to change the name of your image in the code if you didn’t name it ‘img’
# Function to apply YOLO
def apply_yolov8(image, confidence_threshold):
    model = YOLO(*path to downloaded model*)  # Load YOLOv8-model
    results = model(image, conf=confidence_threshold)  # Perform object detection
    return results

corrected_img = cv2.cvtColor(img, cv2.COLOR_BAYER_RG2RGB) # Color correction

confidence_threshold = 0.80
results = apply_yolov8(corrected_img, confidence_threshold)
result_img = results[0].plot()  # Draw bounding box

for result in results[0].obb.xywhr:
        x_center = int(result[0])  # X-coördinaat of the center
        y_center = int(result[1])  # Y-coördinaat of the center
        width = int(result[2])     # Width of the bounding box
        height = int(result[3])    # Height of the bounding box
        rotation = float(result[4]) # Rotation

        area = width * height # Calculate the surface area
        cv2.circle(result_img, (x_center, y_center), radius=15, color=(255, 0, 0), thickness=-1) # Draw red dot in the middle of the object

        print(f"Midpoint object: x = {x_center}, y = {y_center}, Surface area = {area} pixels², Rotation = {rotation}")

# Plot results
plt.subplot(1, 2, 2)
plt.imshow(cv2.cvtColor(result_img, cv2.COLOR_BGR2RGB))
plt.title("Image with bounding boxding boxes en rode stippen")
plt.axis('on')
plt.show()

